A lot of people (at least me) tweet airports codes like PRG ✈ AMS before flights. So I thought it will be interesting to draw a directed graph of flights and airports. Where airports are nodes and flights are edges.
First of all, I created a twitter application, authorized my account within it and got all necessary credentials:
TWITTER_CONSUMER_KEY = ''
TWITTER_CONSUMER_SECRET = ''
TWITTER_ACCESS_TOKEN = ''
TWITTER_ACCESS_TOKEN_SECRET = ''
USER_ID = ''
As a special marker I chose airplane emoji:
MARKER = '✈'
Then I tried to receive all my tweets with that marker but stuck with a huge problem, twitter REST API doesn’t work with emojis in a search query. So I decided to receive a whole timeline and filter it manually. So only the last 3200 tweets will be parsed. Working with twitter API is very easy with tweepy:
import tweepy


def get_tweets():
    auth = tweepy.OAuthHandler(TWITTER_CONSUMER_KEY, TWITTER_CONSUMER_SECRET)
    auth.set_access_token(TWITTER_ACCESS_TOKEN, TWITTER_ACCESS_TOKEN_SECRET)
    api = tweepy.API(auth)
    cursor = tweepy.Cursor(api.user_timeline,
                           user_id=USER_ID,
                           exclude_replies='true',
                           include_rts='false',
                           count=200)
    return cursor.items()
>>> for tweet in get_tweets():
...     print(tweet)
...
Status(_api=<tweepy.api.API object at 0x7f876a303ac8>, ...)
Then I filtered tweets with ✈ in its text:
flight_texts = (tweet.text for tweet in get_tweets()
                if MARKER in tweet.text)
>>> for text in flight_texts:
...     print(text)
...
ICN ✈️ IKT
IKT ✈️ ICN
DME ✈️ IKT
As some tweets may contain more than one flight, like LED ✈ DME ✈ AUH, it’s convenient to extract all three letter parts and build flights like LED ✈ DME and DME ✈ AUH:
def get_flights(text):
    parts = [part for part in text.split(' ') if len(part) == 3]
    if len(parts) < 2:
        return []

    return zip(parts[:-1], parts[1:])


flights = [flight for text in flight_texts
           for flight in get_flights(text)]
uniq_flights = list(set(flights))
>>> uniq_flights
[('ICN', 'IKT'), ('IKT', 'ICN'), ('DME', 'IKT')]
From edges in uniq_flights it’s very easy to get all nodes:
airports = [airport for flight in flights
            for airport in flight]
uniq_airports = list(set(airports))
>>> uniq_airports
['ICN', 'IKT', 'DME']
So now it’s possible to create a graph with networkx and draw it with matplotlib:
import networkx
from matplotlib import pyplot


graph = networkx.DiGraph()
graph.add_nodes_from(uniq_airports)
graph.add_edges_from(uniq_flights)
networkx.draw(graph, with_labels=True, node_size=1000)
pyplot.draw()
pyplot.show()
The graph is very ugly:

But it’s simple to improve it by using different colors depending on nodes and edges weight, and by using graphviz.
from collections import Counter
from matplotlib import cm


def get_colors(all_records, uniq_records):
    counter = Counter(all_records)
    max_val = max(counter.values())
    return [counter[record] / max_val
            for record in uniq_records]


networkx.draw(graph,
              with_labels=True,
              node_size=1000,
              width=1.5,
              pos=networkx.nx_pydot.graphviz_layout(graph, prog='neato'),
              cmap=cm.get_cmap('Pastel1'),
              edge_cmap=cm.get_cmap('Pastel2'),
              edge_color=get_colors(flights, uniq_flights),
              node_color=get_colors(airports, uniq_airports))
pyplot.draw()
pyplot.show()
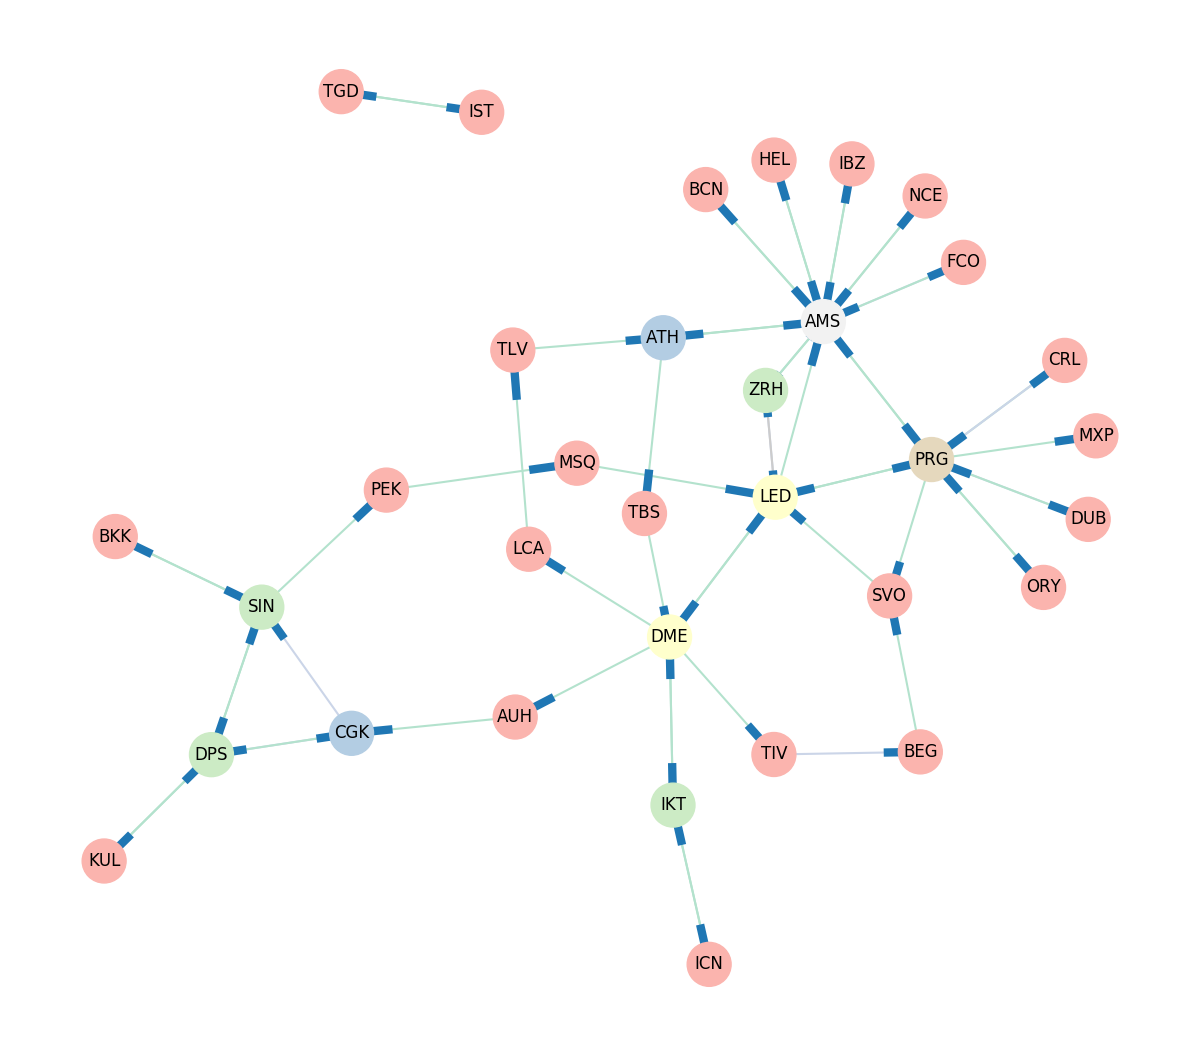
So now it’s much nicer:
